Bullish Engulfing, and the opposite pattern Bearish Engulfing are one of a scant handful of patterns that are legit.
I’m going to teach you the pattern today, show you the exact rules for trading it, and show you some innovative ways to use it in your trading systems.
Buckle up kids, lets head on down to candlestick town!
The exact rules
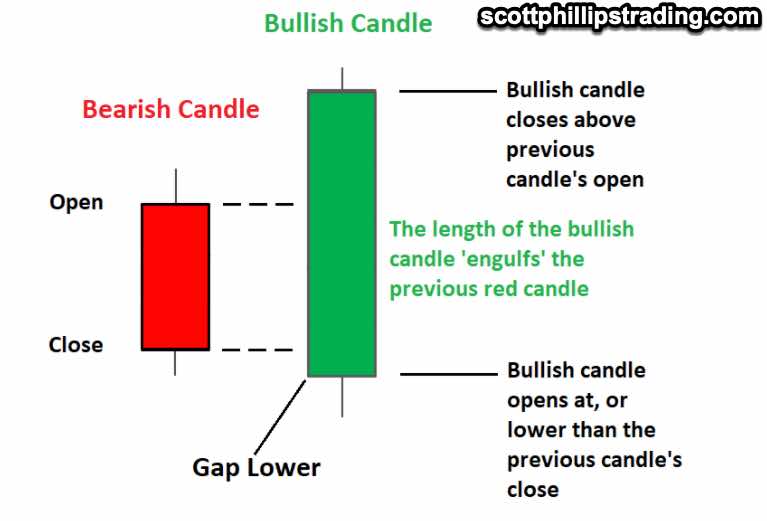
- Candle opens BELOW the real body of the previous candle
- Candle closes ABOVE the real body of the previous candle.
Yeah I know your next question… “whats the real body?” The real body is, in plain language the coloured part of the candle. Defined as “the part of the candle between the open and the close”.
Why is this relevant? Well because the upper and lower wicks (also called the shadow) are extremeties the market tests, but then rejects.
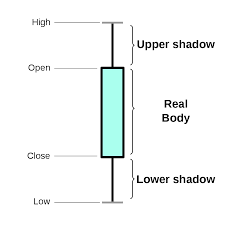
Think about it, if a stock opens at $90, goes as high as $110 and closes at $100, the market is implicily rejecting the proposition that the stock is worth $110. It closed at $100, so that’s the equilibrium price.
So what does a bullish engulfing candle represent?
It’s a situation where the market firstly gapped down, and then reversed.
That’s important, so let’s dissect it a little.
WHY does a market gap down in the first place? A market can only open below the previous close when a lot of sellers sell at once.
Usually this happens because sellers are panicked into selling together, sometimes from a news event.
But here’s the thing. That creates a temporary exhaustion of selling pressure (because all the sellers sold at once) which leaves buyers with the opportunity to take back control.
When the market closes above the previous real body it tells us that buyers HAVE IN FACT TAKEN ADVANTAGE of this exhaustion of selling pressure.
So we have more than a theory here. We have a situation where we have a possible exhaustion of selling pressure AND we have another data point suggesting that this is in fact the case.
So how to trade this pattern, without guessing at it, and without subjective interpretations?
Rules For Trading Bullish Engulfing Pattern
- Candle opens below the previous real body (lowest value of previous open/close)
- Candle closes above the previous real body (lowest value of previous open/close)
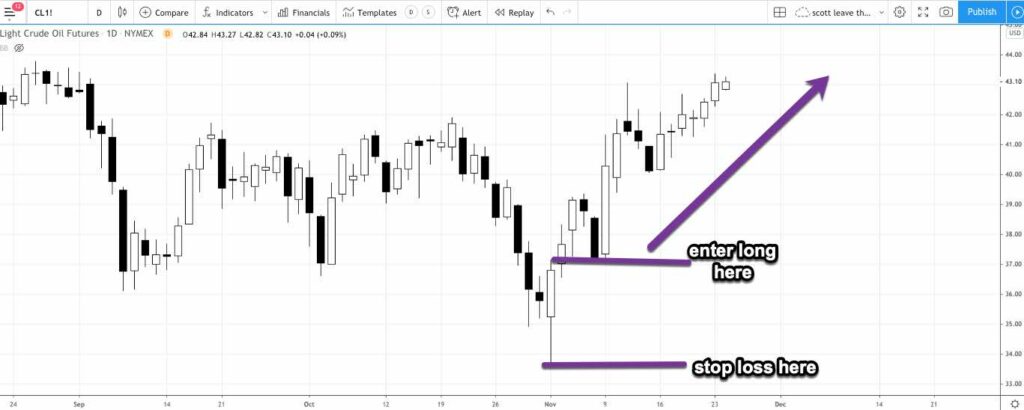
- Enter long when price breaks above the engulfing candle high. Stop loss one tick below the engulfing candle low
This recent example is from crude oil in early November 2020.
Some things to note:
- This is a reversal pattern and is a strong edge at the bottom of trading ranges and at the conclusion of long running trends.
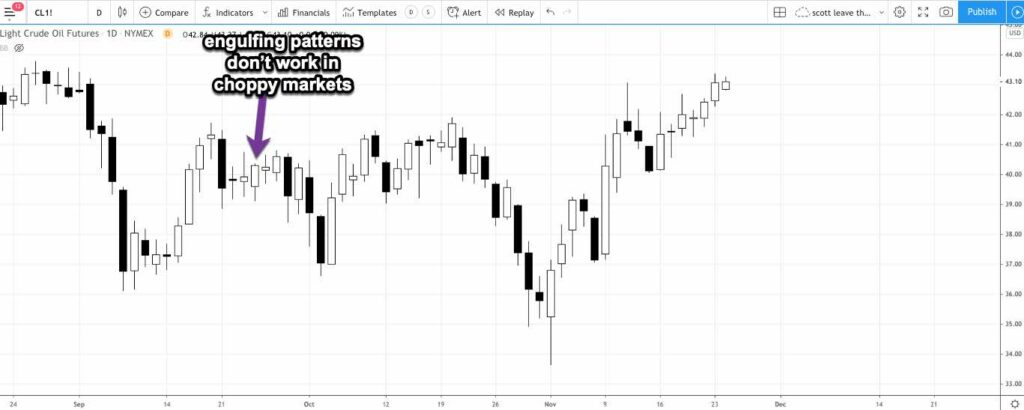
- This is not an edge in choppy markets – see another bullish engulfing candle which did not work in the previous chart
Novel Ways to Use Engulfing Patterns in Trading Systems
Engulfing patterns are arguably MORE USEFUL as exit conditions in trading systems than entry conditions.
Where should you use them? Two obvious rules that can improve most trading systems
Potential Rule 1
When you enter short, and you get a bullish engulfing candle within X candles of entry (usually 3 candles is a good start for testing), exit the trade on close.
This will lower the average losing trade, which improves system performance dramatically.
Potential Rule 2
Once your short trade has made a certain amount (I suggest 2x initial risk), as well as trailing a stop, exit on close if a bullish engulfing candle appears.
If you want to know more about this stuff
I have a comprehensive course on reading the price action, bar-by-bar. It’s cheap, and excellent. You can check it out HERE
Ultimately you WILL HAVE TO BUILD A TRADING SYSTEM. It’s just too hard in the long run to do it any other way.
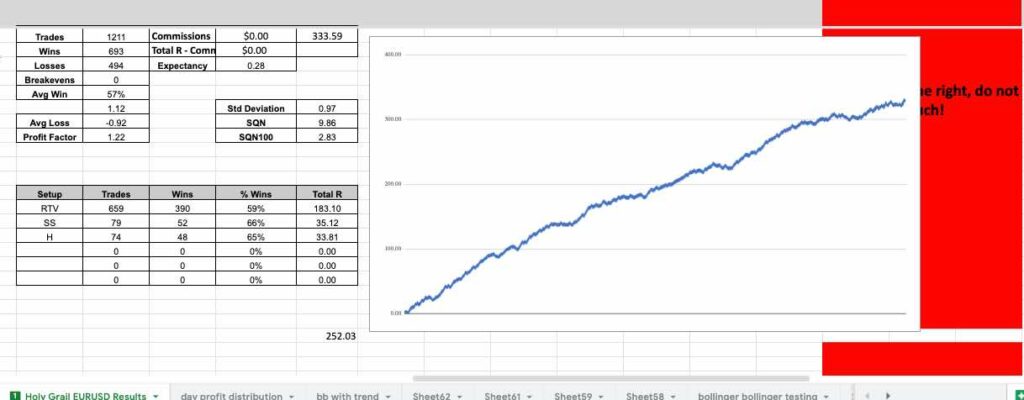
Here’s a free presentation on my own trading system, which absolutely crushes it. I designed it for consistency and low drawdowns.
There are hundreds of candlestick patterns that get thrown around as being worth trading.
The worst ones have cool sounding Japanese names like “3 blind mice”, and they don’t work AT ALL.
In fact, the alpha and omega of this crap is a true-born asshole called Steve Nison, who released a particularly shit-stained book called “Beyond Candlesticks” which I paid for about 15 years ago.
It’s a weighty tome indeed, several kilos of hardcover nonsense that can be safely shredded.
This prick has been travelling around the world teaching “lost charting techniques of the Japanese” for decades now. He doesn’t actually trade, mind you… just teaches the patterns.
And of course, because it’s the trading industry…. virtually none of these patterns are an edge at all. I spent several months of my life laboriously testing most of them in 2008, and sur-fucking-prize… bunkum!
It shouldn’t surprise me, but it does, that some asshole can just sell snake oil for 40 years and never get called out on it, never have to show a trading record, never produce any data proving whether his stuff is an edge.
If you ever read this, enjoy a heartfelt middle finger from me you cocksucker…
Hope that helps – Scott